
Customer Reporting Modernization for a Global Hospitality Organization
Building a Near-Real-Time Snowflake Data Platform and Embedded Power BI Experience That Increased Reporting Usage by 6,000%

A global hospitality organization provided customer-facing analytics as part of a broader procure-to-pay platform used to support purchasing, invoicing, supplier management, receiving, and other procurement activities.
The underlying transactional platform generated a significant amount of valuable business data, but the existing reporting experience was not being widely used by customers. Reporting was disconnected from the core digital experience, the analytical architecture needed modernization, and customers did not have sufficiently current information available through an intuitive reporting experience.
As part of the broader modernization of the procure-to-pay platform, Stackular redesigned both the enterprise data architecture behind reporting and the way customers consumed analytics inside the application.
Stackular implemented an AWS-based change data capture architecture that captured changes from the Oracle transactional database and streamed them into Snowflake through Snowpipe. The resulting analytical data was available within approximately 15 minutes of the underlying business transaction.
Inside Snowflake, Stackular designed and implemented a complete Data Vault 2.0 architecture, including a Raw Vault, Business Vault, and business-ready consumption layer.
Stackular then developed analytical models and customer-facing reports in Microsoft Power BI and used Power BI Embedded to integrate those reports directly into the modern React application.
Customers could access procurement analytics without leaving the application they already used to perform their work.
The result demonstrated that reporting modernization is not simply a data-engineering problem. Data freshness, architecture, analytical design, and the customer experience all contribute to whether people actually use the information an organization provides.
The Challenge
Reporting was an important component of the organization's customer-facing procure-to-pay offering.
Customers generated large amounts of operational data through activities including:
- purchasing
- purchase orders
- invoicing
- receiving
- suppliers
- procurement activity
- spend
- locations
- categories
- financial transactions
That information had significant analytical value.
Customers wanted to understand questions such as:
- Where are we spending money?
- Which suppliers are receiving that spend?
- How is purchasing changing over time?
- What trends exist across locations?
- How do different categories compare?
- Where are there opportunities to improve procurement behavior?
- How recent is the information being presented?
- What changed since the last time the customer reviewed the data?
The existing reporting architecture and customer experience limited how effectively customers could answer those questions.
The modernization therefore could not stop at building new dashboards.
Stackular needed to redesign the complete analytics lifecycle:
Oracle → CDC → Snowpipe → Snowflake → Data Vault 2.0 → analytical models → Power BI → embedded React experience
Reporting as Part of the Product
One of the central principles of the modernization was that analytics should be treated as a product capability, not simply as a separate reporting system.
Customers were already using the procure-to-pay application to perform business activities.
They should not need to leave that experience, navigate to another application, and mentally switch from "doing the work" to "looking at the data."
Stackular therefore modernized both sides of the reporting platform.
The Data Experience
How operational information was:
- captured
- transported
- historized
- modeled
- transformed
- governed
- prepared for analytics
The Customer Experience
How customers:
- discovered reports
- accessed reports
- interacted with data
- moved between operational workflows and analytics
Improving only one side would have left a significant part of the problem unsolved.
Near-Real-Time Change Data Capture from Oracle
The procure-to-pay application used an Oracle database for transactional processing.
Rather than placing analytical workloads directly against Oracle, Stackular created a dedicated analytical architecture.
An AWS-based change data capture process continuously identified changes occurring in the transactional Oracle database.
Those changes were streamed into Snowflake through Snowpipe.
This created a near-real-time pipeline from the operational system into the analytical environment.
The architecture reduced analytical data latency to approximately 15 minutes.
Conceptually:
Change data capture separates analytics from transactions
- System of recordOracleTransactional procure-to-pay database
- CaptureAWS-based CDCContinuously identifies business-data changes
- StreamStreaming change feedMoves incremental changes toward analytics
- IngestSnowpipeLoads changes into the analytical platform
- DestinationSnowflakeDedicated analytical environment
This approach allowed customers to access substantially fresher analytical information without requiring reporting workloads to run directly against the production transaction-processing environment.
Why Change Data Capture Instead of Traditional Batch ETL?
Traditional analytical platforms frequently extract large groups of records on a scheduled basis.
For example:
Extract everything that changed overnight.
That approach may be sufficient for reporting that only needs to be refreshed once per day.
It becomes less effective when customers need information that reflects recent operational activity.
Change data capture focuses instead on identifying the changes occurring in the source system.
This allows the analytical platform to process smaller, more continuous streams of data rather than repeatedly extracting large datasets.
For this implementation, CDC helped reduce the gap between an activity occurring in the procure-to-pay platform and that activity becoming available for analytics to approximately 15 minutes.
Why Separate Transactional and Analytical Workloads?
Transactional systems and analytical systems solve fundamentally different problems.
Oracle needed to answer questions such as:
What is the current state of this purchase order?
Snowflake needed to answer questions such as:
How has purchasing changed across every location, supplier, category, and month during the last several years?
Analytical workloads often require:
- large scans
- historical comparisons
- aggregations
- transformations
- complex joins
- period-over-period calculations
- customer-specific analytical models
Executing those workloads directly against a transactional application database can create unnecessary competition with business operations.
Moving analytics into Snowflake allowed:
Oracle to focus on executing procure-to-pay transactions.
Snowflake to focus on historical data, analytics, reporting, and analytical scale.
Building a Complete Data Vault 2.0 Architecture
Stackular designed and implemented a complete Data Vault 2.0 architecture in Snowflake.
The implementation included:
- Raw Vault
- Business Vault
- business-ready consumption and reporting layers
The goal was not simply to recreate the Oracle database in Snowflake.
Stackular created an enterprise analytical architecture capable of preserving history, maintaining traceability, applying business logic, and supporting reporting requirements that could continue evolving over time.
Raw Vault
The Raw Vault provides the foundational integrated historical layer.
It captures business entities, relationships, and descriptive source information while maintaining a strong connection to the originating source data.
Typical Data Vault concepts include:
Hubs
Represent stable business concepts.
Examples in a procurement environment may include concepts such as:
- suppliers
- customers
- locations
- purchase orders
- invoices
- products
Links
Represent relationships between business concepts.
For example:
- supplier associated with a purchase order
- invoice related to a purchase order
- customer associated with a location
Satellites
Maintain descriptive information and historical changes associated with hubs and links.
Together, these structures create an architecture designed to preserve how enterprise information changes over time.
Business Vault
The Business Vault sits above the Raw Vault and introduces business rules and derived logic.
This layer allows raw historical data to be transformed into information that more closely represents how the business interprets and uses the data.
Business Vault processing can support:
- derived values
- business relationships
- reusable calculations
- standardized logic
- business rules
- transformed historical information
Separating these rules from raw ingestion creates a clearer boundary between:
what the source system reported
and
how the business interprets that information.
Consumption and Reporting Layer
Business users and Power BI reports should not need to understand Data Vault structures.
Stackular therefore created a dedicated consumption layer above the Raw and Business Vaults.
This layer translates the enterprise data platform into analytical models designed around customer questions.
The consumption layer can organize information around concepts such as:
- spend
- suppliers
- invoices
- purchase orders
- locations
- categories
- time periods
- procurement performance
This gives Power BI a business-oriented analytical model rather than requiring individual reports to reconstruct complex Data Vault relationships.
The architecture therefore follows a deliberate progression:
Traceable source data becomes business-ready analytics
- Source dataIncremental operational changes
- Raw VaultHistorical preservation and source traceability
- Business VaultBusiness rules and derived relationships
- Consumption layerBusiness-oriented analytical models
- Power BICustomer reports and reusable metrics
Why Data Vault 2.0?
The organization's procurement platform contained complex business relationships and substantial historical information.
Reporting requirements also continued to evolve.
A data platform designed only around the reports that existed on the day it was built would eventually become restrictive.
Stackular chose Data Vault 2.0 because the architecture supports characteristics such as:
- historical preservation
- source traceability
- extensibility
- incremental loading
- changing source structures
- integration of additional datasets
- scalable enterprise data modeling
- separation of source data from business rules
That gave the organization a foundation capable of supporting questions that had not yet been identified when the platform was originally designed.
Preserving Procurement History
Procure-to-pay analytics is inherently historical.
A current transactional record only tells part of the story.
Customers want to analyze questions such as:
- How has supplier spend changed?
- How have purchasing patterns evolved?
- How does this quarter compare with last year?
- Which categories are growing?
- How has activity shifted between locations?
- How have supplier relationships changed?
Historical preservation makes those questions possible.
Rather than maintaining only the latest representation of operational data, the Data Vault architecture provides a foundation for understanding how business information evolved over time.
Creating Business-Ready Analytical Models
Data Vault and business intelligence have different responsibilities.
The Data Vault is optimized around:
- history
- integration
- auditability
- adaptability
- source traceability
Power BI users need:
- understandable metrics
- intuitive dimensions
- straightforward relationships
- reusable calculations
- fast analytical queries
Stackular therefore created analytical models specifically for reporting instead of exposing Raw Vault structures directly to the BI layer.
That separation reduced report complexity and allowed business definitions to be centralized rather than recreated independently across dashboards.
Power BI Customer Reporting
Stackular used Microsoft Power BI to create the customer-facing analytical experience.
The reports provided interactive analytics rather than static reports.
Customers could work with data through capabilities such as:
- filtering
- slicing by business dimensions
- trend analysis
- comparisons
- drill-down
- interactive visuals
- different analytical perspectives
The objective was to turn transactional data into information customers could use to understand and improve their procurement operations.
Embedding Power BI in the React Application
One of the most important product decisions was to integrate analytics directly into the application.
Stackular implemented Power BI Embedded within the React frontend.
Instead of asking customers to navigate to a separate BI environment, reports appeared within the same digital application they already used for procure-to-pay activities.
The experience became:
One customer application, two connected capabilities
- Operational procurementPurchasing and transaction workflows
- Power BI EmbeddedAnalytics inside the existing workflow
Replaces a separate reporting portal and the extra navigation, authentication, and context switching it required.
Reducing that separation made reporting significantly easier to discover and consume.
Why Embedded Analytics Matters
Enterprise reporting projects frequently devote significant attention to data models and dashboards while spending comparatively little time thinking about how users actually reach those reports.
But accessibility has a major effect on adoption.
Users are less likely to consume analytics when they must:
- remember another URL
- enter another application
- authenticate separately
- leave their workflow
- understand which reporting environment to use
Power BI Embedded allowed analytics to become a natural component of the product rather than an external destination.
6,000% Increase in Report Page Views and Usage
Following the reporting modernization, customer report page views and overall usage increased by approximately 6,000%.
That is one of the most important outcomes of the project.
The organization already had reporting before the modernization.
The problem was not simply a lack of reports.
The modernization changed the complete experience:
- data became available within approximately 15 minutes
- analytical processing moved to Snowflake
- historical data was organized using Data Vault 2.0
- business-ready models were introduced
- customer reports were rebuilt in Power BI
- Power BI was embedded directly into the React application
Together, those changes turned reporting from an underutilized capability into a much more actively consumed part of the platform.
Architecture Overview
The complete architecture can be represented as:
From business transaction to embedded customer insight
- TransactionsOracleProcure-to-pay system of record
- Capture + ingestionAWS CDC + SnowpipeStreaming changes available in approximately 15 minutes
- Snowflake / Data Vault 2.0Enterprise analytical platform
- Raw VaultHistory + traceability
- Business VaultRules + relationships
- Consumption modelsBusiness-ready analytics
- Business intelligencePower BIReports, semantic models, and interactive analytics
- Embedded experiencePower BI Embedded + ReactAnalytics integrated into the customer application
- OutcomeEnd customersDiscoverable, current insight in the flow of work
Each layer has a distinct responsibility.
Oracle
Runs the transactional procure-to-pay application.
AWS-Based CDC
Identifies changes in the operational database.
Snowpipe
Streams incoming changes into the Snowflake analytical environment.
Snowflake
Provides scalable analytical storage and processing.
Raw Vault
Preserves integrated source-aligned historical data.
Business Vault
Applies reusable business logic and derived analytical rules.
Consumption Layer
Transforms enterprise data into models optimized for business reporting.
Power BI
Provides the interactive visualization and analytical experience.
Power BI Embedded
Integrates those reports directly into the React customer application.
Key Technical Decisions
Why Snowflake?
Snowflake provided a scalable cloud platform specifically suited to analytical workloads.
Moving analytics away from Oracle allowed reporting to scale independently from the transactional application and created a better environment for historical enterprise data.
Why AWS-Based CDC?
The objective was to make operational changes available analytically without repeatedly extracting the entire Oracle dataset.
Change data capture provided a more continuous approach to identifying and moving changes.
Why Snowpipe?
Snowpipe provided the ingestion mechanism for continuously loading streamed data into Snowflake.
Together with CDC, it supported the approximately 15-minute source-to-analytics latency required by the new reporting platform.
Why Approximately 15 Minutes?
Not every business problem requires true real-time analytics.
The architectural goal should be to provide data as quickly as the business actually needs it rather than introducing additional cost and complexity purely to claim real-time processing.
For this customer-facing procurement use case, approximately 15 minutes provided a strong balance between freshness and architectural practicality.
Why Data Vault 2.0?
The platform needed to support changing sources, historical data, complex business relationships, and evolving reporting requirements.
Data Vault 2.0 provided a durable foundation rather than designing the warehouse around a fixed set of current dashboards.
Why Implement Both Raw Vault and Business Vault?
The Raw Vault preserves source-aligned history.
The Business Vault introduces reusable business interpretation and derived logic.
Keeping those responsibilities separate improves traceability and allows business rules to evolve without rewriting the raw historical foundation.
Why Add a Consumption Layer?
Power BI users should not have to understand the implementation details of Data Vault.
A dedicated consumption layer simplifies the analytical experience and creates reusable business-ready data structures.
Why Power BI?
Power BI provided a mature platform for interactive customer-facing analytics and supported the embedding capabilities needed for the modern application.
Why Power BI Embedded?
The reporting experience was intended for customers inside the product, not simply internal analysts opening Power BI separately.
Power BI Embedded made analytics part of the application experience.
Why Embed Reports in React?
The objective was to reduce the distance between operational activity and analytical insight.
Customers could perform procurement activities and consume related analytics within the same application instead of moving between disconnected systems.
Business Results
6,000% Increase in Customer Reporting Usage
Report page views and usage increased by approximately 6,000% after the modernization.
This provided direct evidence that customers were engaging substantially more with the new analytical experience.
Approximately 15-Minute Data Availability
Changes occurring in the Oracle transactional platform became available to the analytical environment in approximately 15 minutes.
Near-Real-Time Customer Analytics
Customers could work with significantly fresher procurement data instead of relying on traditional slow reporting cycles.
Dedicated Analytical Platform
Snowflake separated complex reporting workloads from the Oracle transactional application.
Complete Data Vault 2.0 Architecture
The implementation included Raw Vault, Business Vault, and consumption layers rather than using Data Vault only as a modeling concept.
Historical Enterprise Data
The platform created a durable foundation for historical procurement analysis.
Reusable Business Logic
The Business Vault and consumption models centralized transformations and analytical definitions instead of embedding them independently in reports.
Embedded Analytics
Power BI became part of the React application customers already used.
Improved Reporting Discoverability
Customers no longer needed to treat analytics as a separate destination.
Scalable Reporting Foundation
The organization gained an architecture capable of supporting additional data sources, models, reports, and customer analytical requirements over time.
Technologies Used
Lessons for Organizations Modernizing Customer Reporting
Reporting Adoption Is a Product Metric
Delivering a report does not mean customers are receiving value from it.
Organizations should measure whether customers actually use analytics.
In this implementation, the approximately 6,000% increase in page views and reporting usage provided strong evidence that modernization changed customer behavior.
Reporting Is Both a Data Problem and a UX Problem
Excellent data architecture cannot overcome a reporting experience customers cannot find or do not want to use.
Conversely, attractive dashboards cannot compensate for stale or unreliable data.
Successful reporting platforms require both.
Don't Make the Transactional Database Your Data Warehouse
Oracle and Snowflake had different jobs.
Keeping operational and analytical workloads separate made it possible to optimize each platform independently.
Near Real Time Doesn't Have to Mean Milliseconds
The correct latency depends on the business problem.
Approximately 15-minute data availability provided customers with substantially fresher information without requiring every event to be processed synchronously.
Use CDC When Data Freshness Matters
Change data capture can significantly reduce latency compared with large periodic batch extracts.
It also avoids repeatedly moving data that has not changed.
Build the Data Platform for Questions You Haven't Been Asked Yet
Today's reports should not dictate the entire enterprise data architecture.
Data Vault provides a foundation capable of accommodating new questions, new sources, and changing business relationships.
Separate Raw History from Business Interpretation
Raw source history and business rules serve different purposes.
Separating Raw Vault from Business Vault improves traceability and makes analytical logic easier to evolve.
Don't Make BI Tools Understand Your Data Vault
The Power BI model should be designed for analytics.
A dedicated consumption layer allows the warehouse architecture and BI experience to evolve independently.
Put Analytics Where Customers Already Work
One of the most effective ways to increase analytical adoption is to eliminate the need to visit a separate analytics environment.
Embedded analytics turns reporting into part of the product.
Frequently Asked Questions
What is Data Vault 2.0?
Data Vault 2.0 is a methodology for designing enterprise data platforms around historical preservation, scalability, auditability, source traceability, and adaptability.
The model generally separates business entities, relationships, descriptive historical information, and business transformation logic.
What is the difference between a Raw Vault and Business Vault?
The Raw Vault preserves integrated source-aligned historical information with limited business interpretation.
The Business Vault applies reusable business rules, derived calculations, and transformations above that raw historical foundation.
Keeping them separate helps maintain source traceability while allowing business logic to evolve.
Do you still need a reporting layer with Data Vault?
Usually, yes.
Raw and Business Vault structures are designed primarily for enterprise data management rather than direct business consumption.
A reporting or consumption layer can provide simplified models optimized for Power BI and other analytical tools.
Why use Data Vault with Snowflake?
Snowflake provides scalable cloud data storage and processing.
Data Vault provides an architectural methodology for organizing historical and integrated enterprise data.
Together they can provide a strong foundation for organizations with evolving source systems and reporting requirements.
What is change data capture?
Change data capture identifies inserts, updates, and deletes occurring in a source system so those changes can be propagated to downstream systems.
This can provide significantly lower analytical latency than periodically reloading entire datasets.
What is Snowpipe?
Snowpipe is a Snowflake capability used to continuously ingest incoming data into Snowflake.
In this architecture, data captured from Oracle was streamed to Snowpipe for ingestion into the Snowflake analytical platform.
What does near-real-time analytics mean?
Near-real-time analytics means information becomes available for analysis soon after the underlying business event occurs rather than waiting for a traditional overnight batch.
In this implementation, source changes became available to the analytical environment in approximately 15 minutes.
Why not make the reporting truly real time?
True real-time processing introduces additional architectural complexity and cost.
The appropriate target should be based on business requirements.
For this procurement reporting use case, approximately 15 minutes provided customers with sufficiently current information without requiring every analytical update to occur instantaneously.
What is Power BI Embedded?
Power BI Embedded allows Power BI reports and analytical experiences to be integrated directly into another application.
Users can interact with analytics without leaving the product where they perform their normal work.
Can Power BI be embedded inside a React application?
Yes.
Power BI Embedded supports integration with modern web applications, including applications built using React.
Identity, authorization, report access, tenant design, licensing, and data security should all be considered as part of the embedding architecture.
Why embed analytics instead of sending users to Power BI?
Embedded analytics reduces context switching.
Customers can access reports as part of the same application experience rather than learning and navigating a separate BI environment.
That can materially improve report discoverability and adoption.
Does faster data automatically improve report adoption?
No.
Data freshness is only one factor.
Adoption also depends on:
- usefulness
- report design
- performance
- discoverability
- ease of access
- integration into customer workflows
This project addressed the entire experience rather than changing only the refresh frequency.
How can organizations increase usage of customer-facing reports?
Organizations should evaluate the complete reporting journey:
- Is the underlying data trusted?
- Is it sufficiently current?
- Are metrics understandable?
- Are reports easy to use?
- Can customers find them?
- Are users forced into another application?
- Are reports aligned with actual customer questions?
In this implementation, modernizing both the architecture and the customer experience resulted in an approximately 6,000% increase in report page views and usage.
Related Case Studies
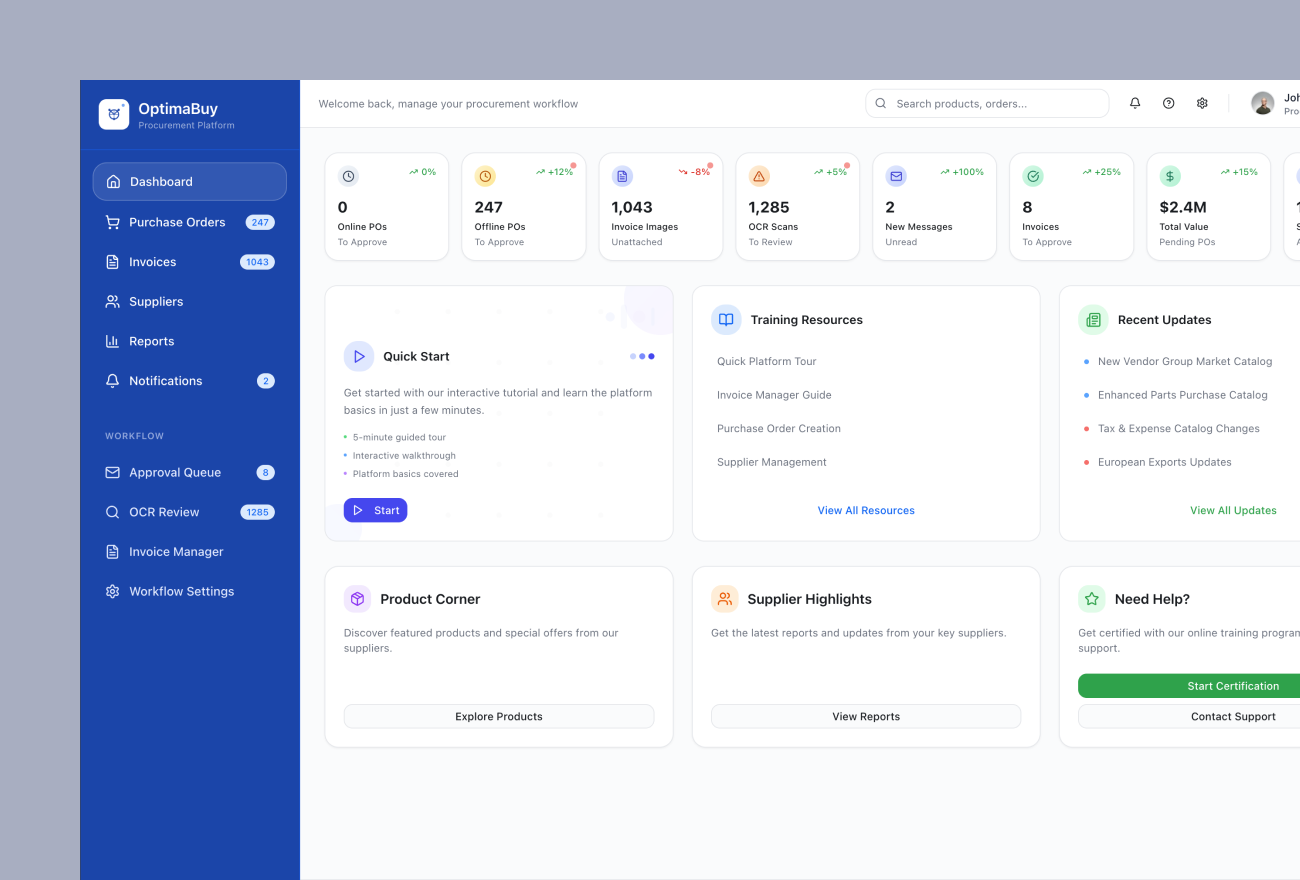
Procure-to-Pay Application Modernization for a Global Hospitality Organization
A global hospitality organization relied on a long-running procure-to-pay platform supporting purchasing, purchase orders, invoicing, receiving, financial workflows, supplier interactions, and customer-facing business processes.

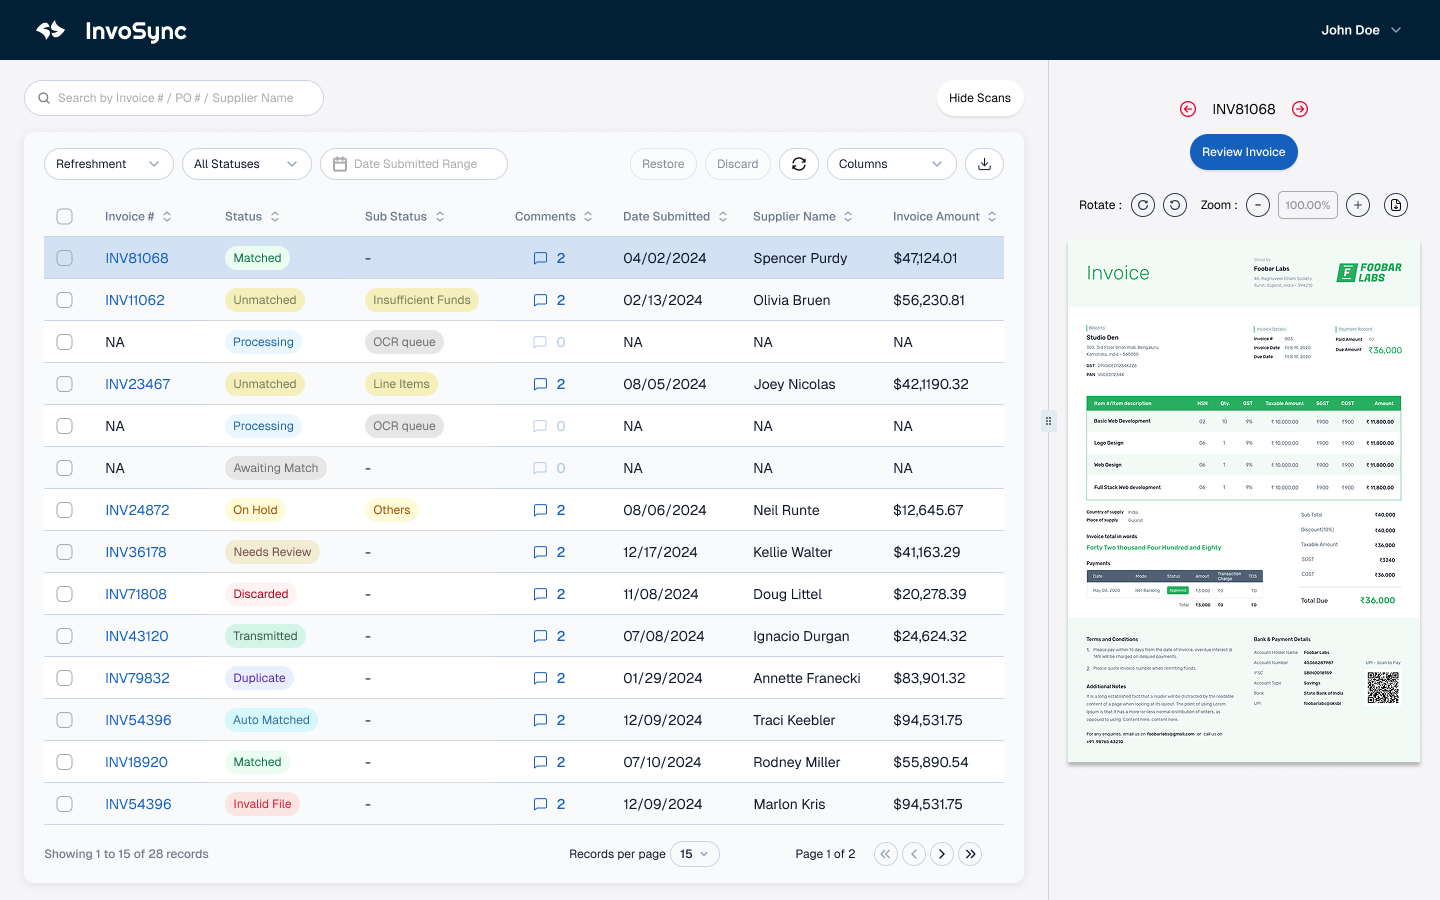
AP Automation for a Global Hospitality Organization
A global hospitality organization needed to modernize a highly manual accounts-payable process within a larger procure-to-pay platform.
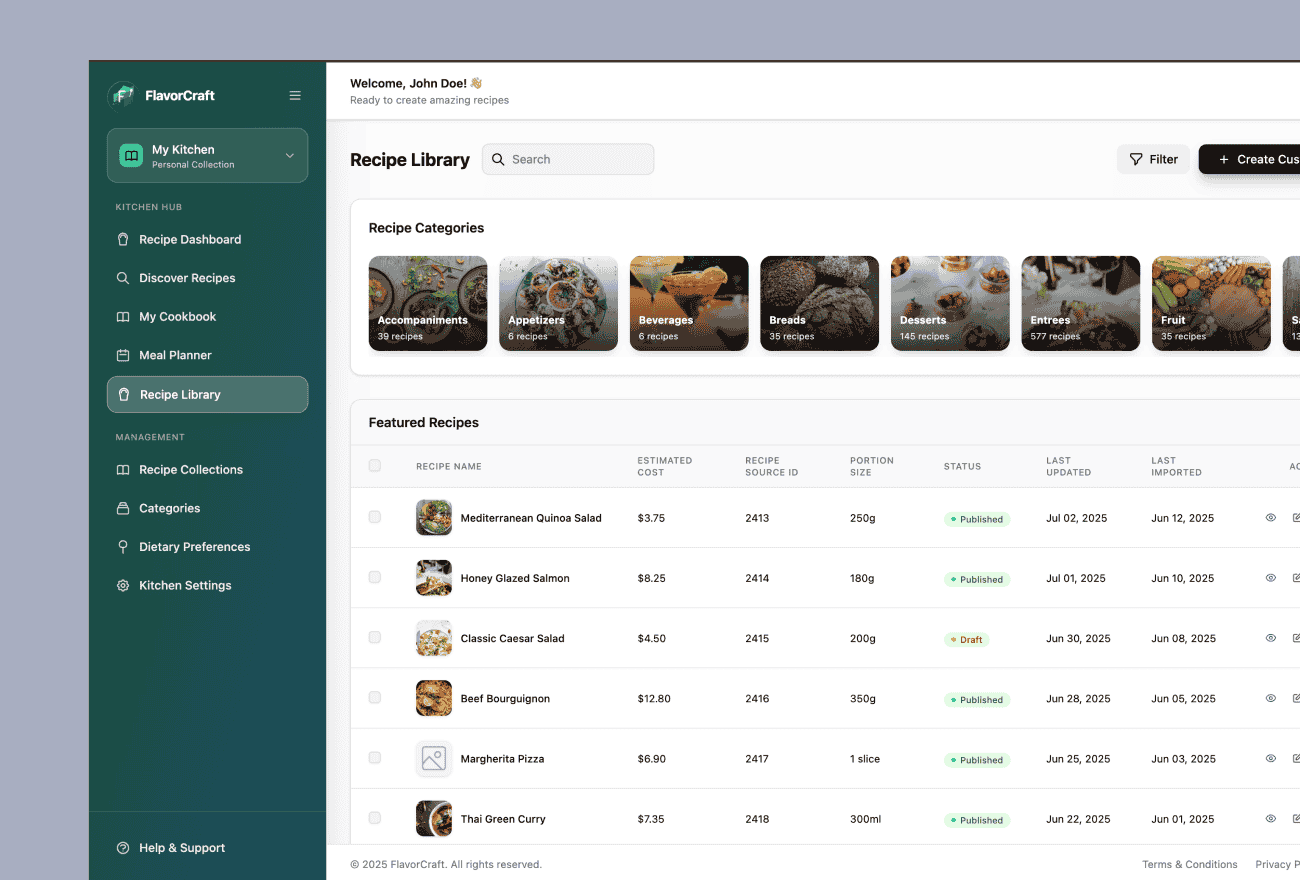
Extranet Modernization for a Global Hospitality Organization
A global hospitality organization relied on a long-running extranet to provide customers and business partners with access to operational content, training, supplier information, menus, recipes, alerts, and other digital services.